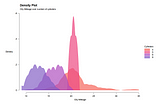
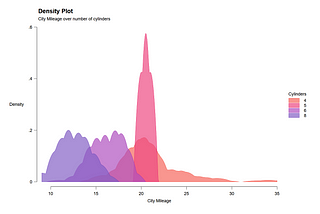
PinnedFahad MirzainThe Stata GalleryTop 25 Stata Visualizations — With Full CodeHaving trouble deciding what visualization to use for the type of problem at hand in Stata? This tutorial can help you decide!25 min read·Nov 19, 2022--3--3
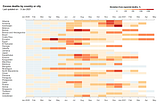
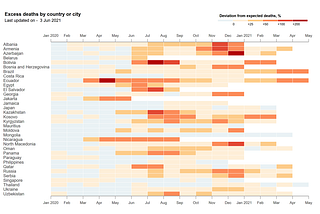
PinnedFahad MirzainThe Stata GuideStata Graph Replication: The Economist’s Covid-19 Excess Death visualizationThis guide provides a walkthrough on how to replicate the Excess Death heatplot visualization by The Economist in Stata.28 min read·Jun 14, 2021--1--1
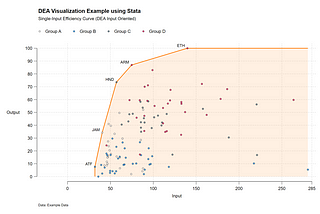
Fahad MirzainThe Stata GalleryData Envelopment Analysis (DEA)Visualization using StataNote: This walkthrough will not go through basics of Stata and will assume that the reader is somewhat familiar in the use of matrices…10 min read·Apr 3, 2024----
Fahad MirzaCovid-19 Daily Data Download & Automation using Stata: Sourced from Johns Hopkins University (JHU)…This guide aims to provide a tutorial on how to set up a Stata do-file that automatically downloads, cleans and appends data for Pakistan…15 min read·Aug 28, 2021----